3DCOMET: 3D Compression Methods Test Dataset
Tools
The 3DCOMET dataset is released in conjunction with two different tools for computing results statistics. These tools can be downloaded from:
https://bitbucket.org/vmorell/3dcomet-tools/
Compression tester
The first one is a compression tester appllication, which analyses the results of given 3D compression methods. It starts from a directory with three subdirectories: original, compressed and decompressed data. These three subdirectories must keep the original structure. The original data are the images in binary (uncompressed) format. Then, from the compressed data, each file is compared with the original one, obtaining the compression ratio. Some metrics are calculated, which will be used later in conjunction with the second tool to generate some graphs about the obtained results. This application has been developed in C++ using the PointCloud library
Usage:
compressionTester general_path original_folder compressed_folder reconstructed_folder - Executable for Linux systems (tested on Debian and Ubuntu)
- Executable for Windows systems (tested on Windows XX)
- Executable for MacOSx systems (tested on 10.9)
Statistics computation
The next tool uses a file with the statistics obtained from the dataset: curvature and entropy. In the GitHub repositorie, there is a project (computeStats) which can be used for generating those statistics. This project generates the statistics for one file:
computeStats pointCloudThe statistics for all the dataset have been generated in a single file: statistics.csv. Using the output from the compression tester and this file, the both could be concatenate in one single file, which is the one used for the next tool.
concatStats compressionTesterOutput statistics.csv > jointStatisticsStatistics generator
The second tool is a Gnuplot script that provides with the following capabilities:
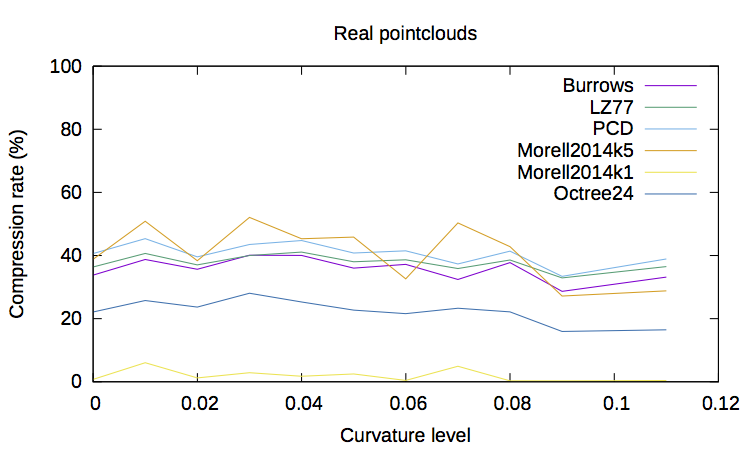
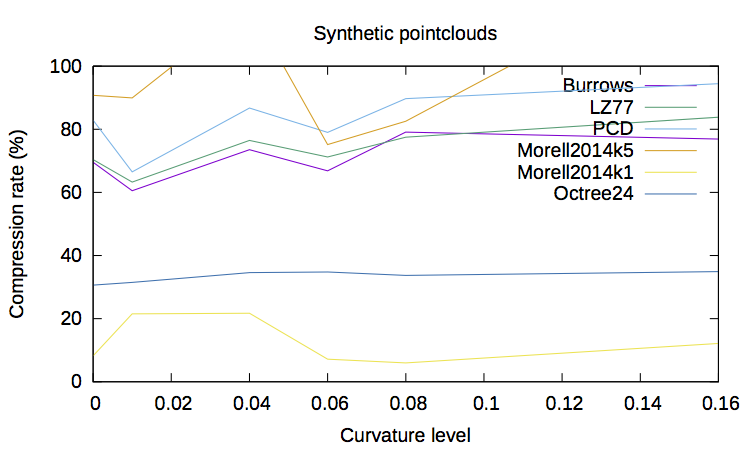
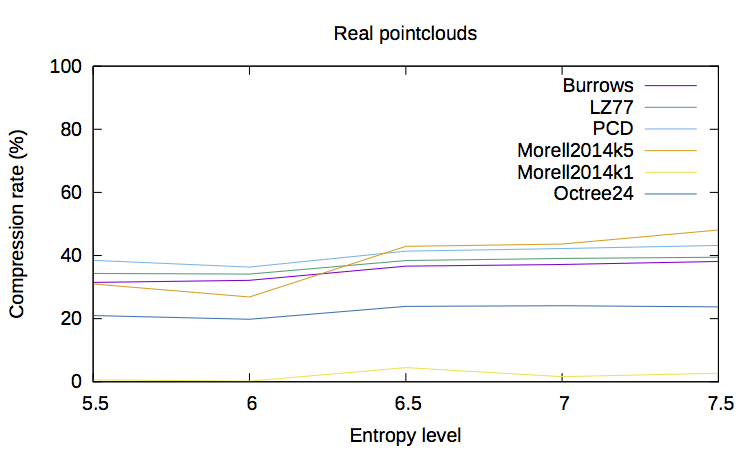
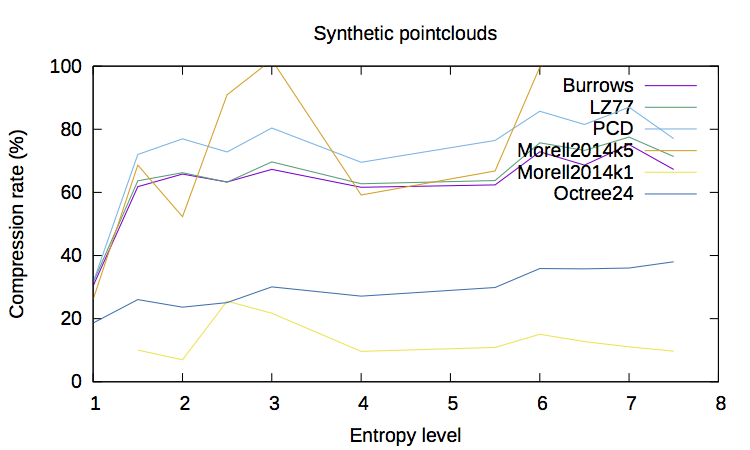
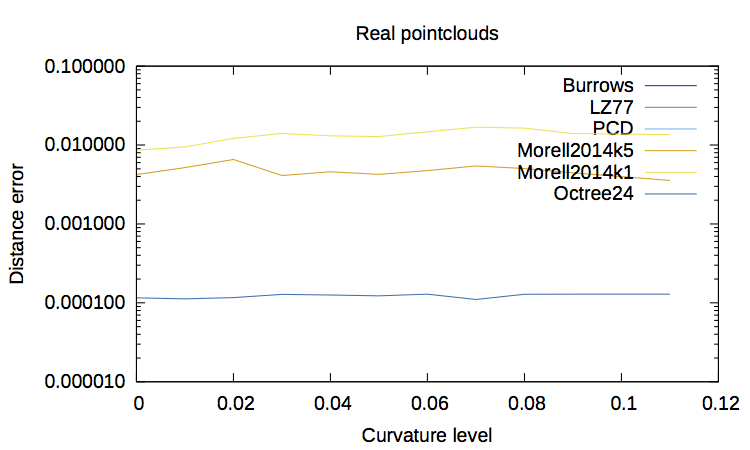
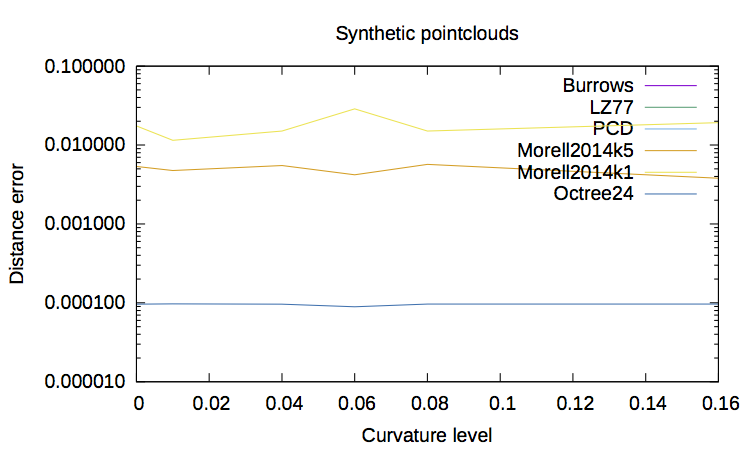
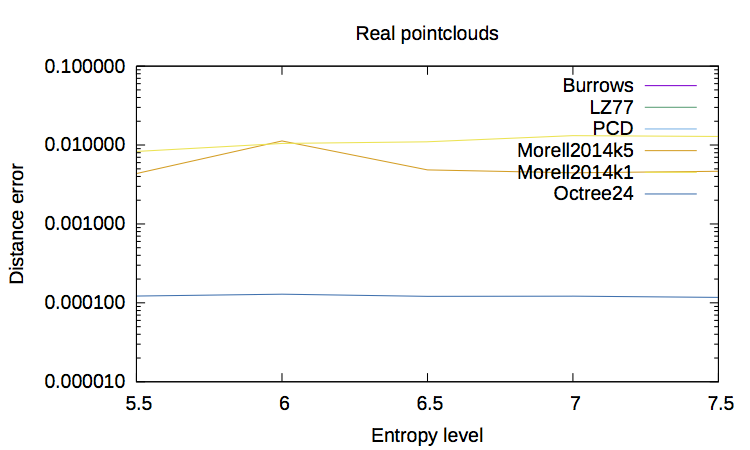
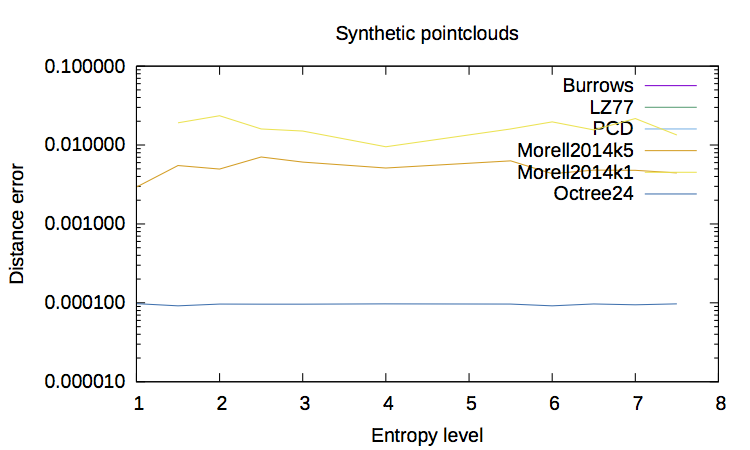
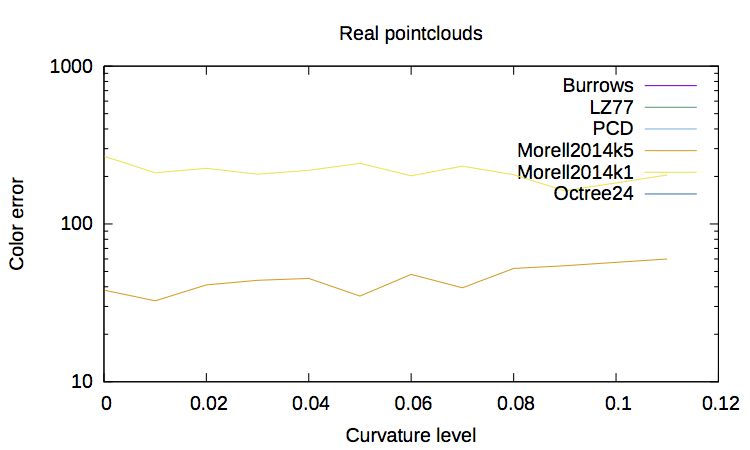
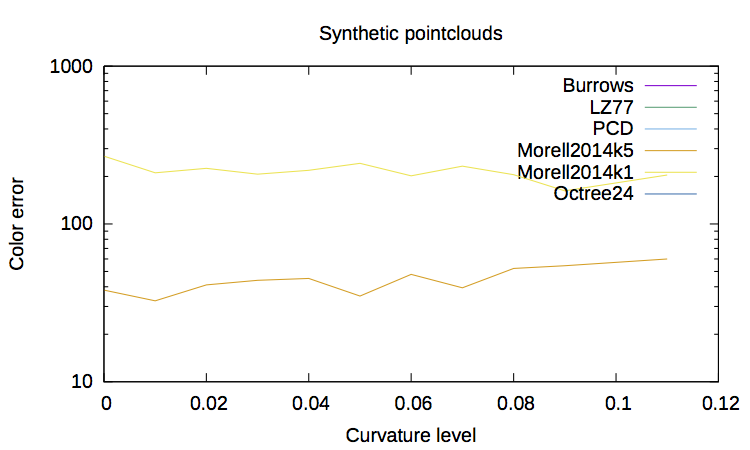
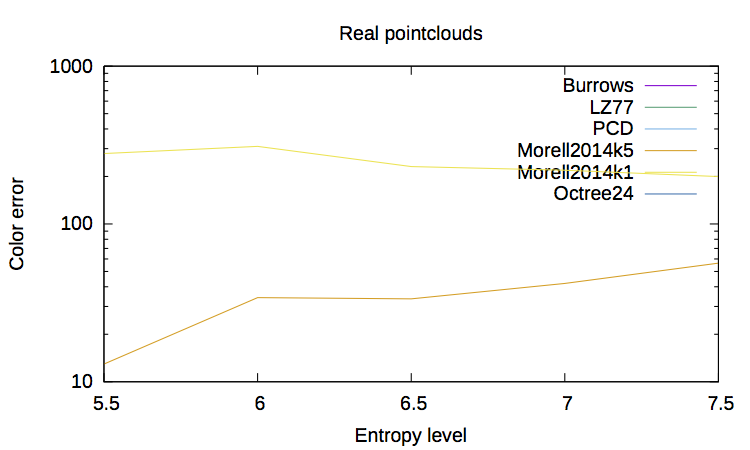
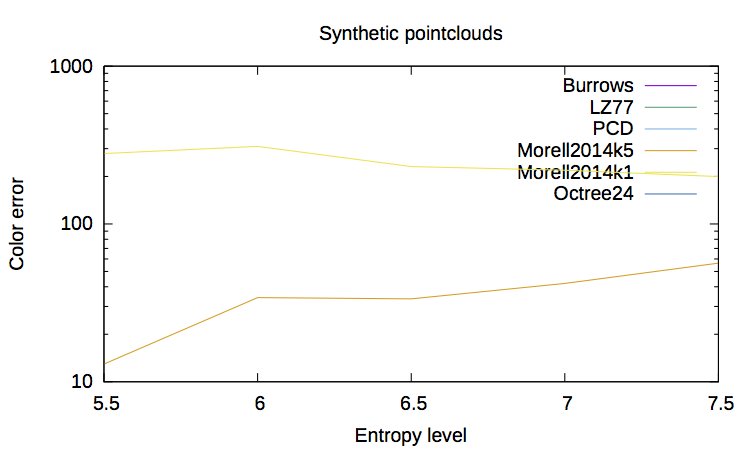
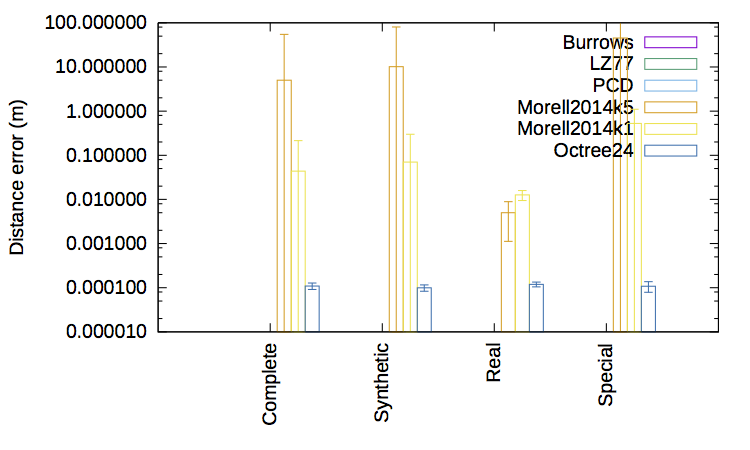
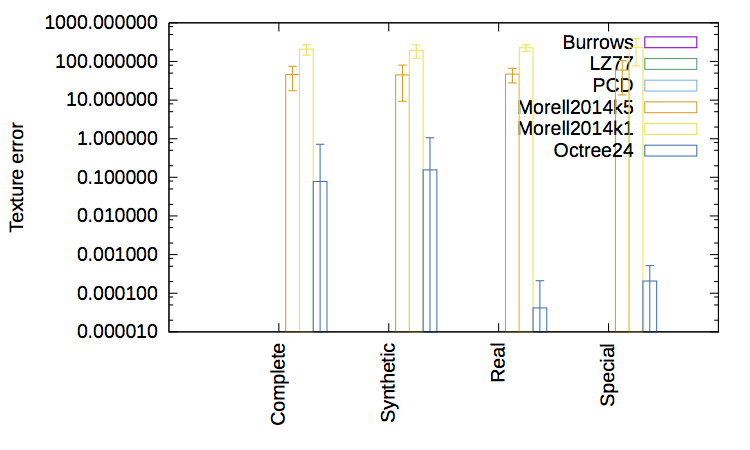
Results comparison: this tool generates three graphs that compare the results between different compression methods. It takes as an input the data generated by the previous utility provided in this dataset REF. The first graph shows the compression rate obtained for each compression method. The second graph shows the distance error for each uncompressed 3D point regard the original one. Finally, the third graph shows the color error using the nearest neighbour (3D point) from the original point cloud.
In conjunction with the dataset, five methods are provided as a baseline for further progresses on the development of new methods for 3D data compression. In ProvidedResults.zip, the statistics for these five methods are provided and they can serve as a baseline for future comparison.
gnuplot -e "f1='Octree24'" -e "f2='PCD'" -e "f3='LZ77'" -e "f4='Burrows'" -e "f5='Morell2014k1'" -e "f6='Morell2014k5'" -e "m='SY TE'" -e "t='pdf'" plot.gpA different number of files can be passed as an argument. Each file must be separated using the the following option:
-e "fi='name'"In addition, the Gnuplot script allows to specify the output by using the option -e "t='terminal'" where the kind of terminal must be specified. The default terminal is the one present in your operating system. You can use the option 'pdf' to export the output to a PDF file. For generating LaTeX content you can use the 'latex' option. Examples of terminals are x11 for Linux or aqua or qt for Mac.
-e "t='aqua'"-e "m='SY TE'"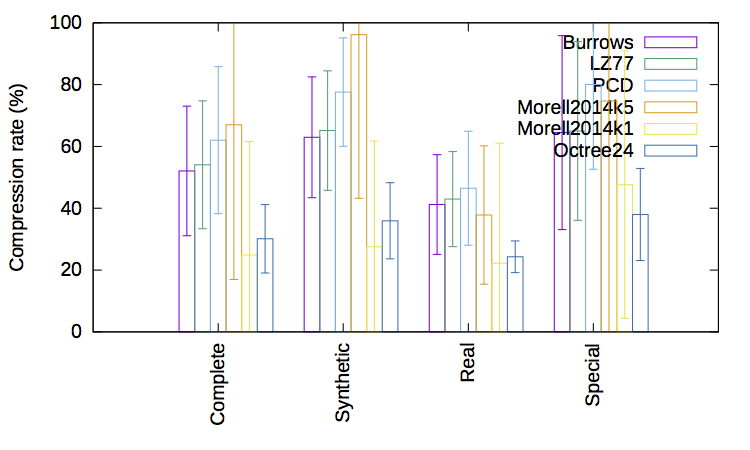
-e "l='true'"-e "m='true'"
